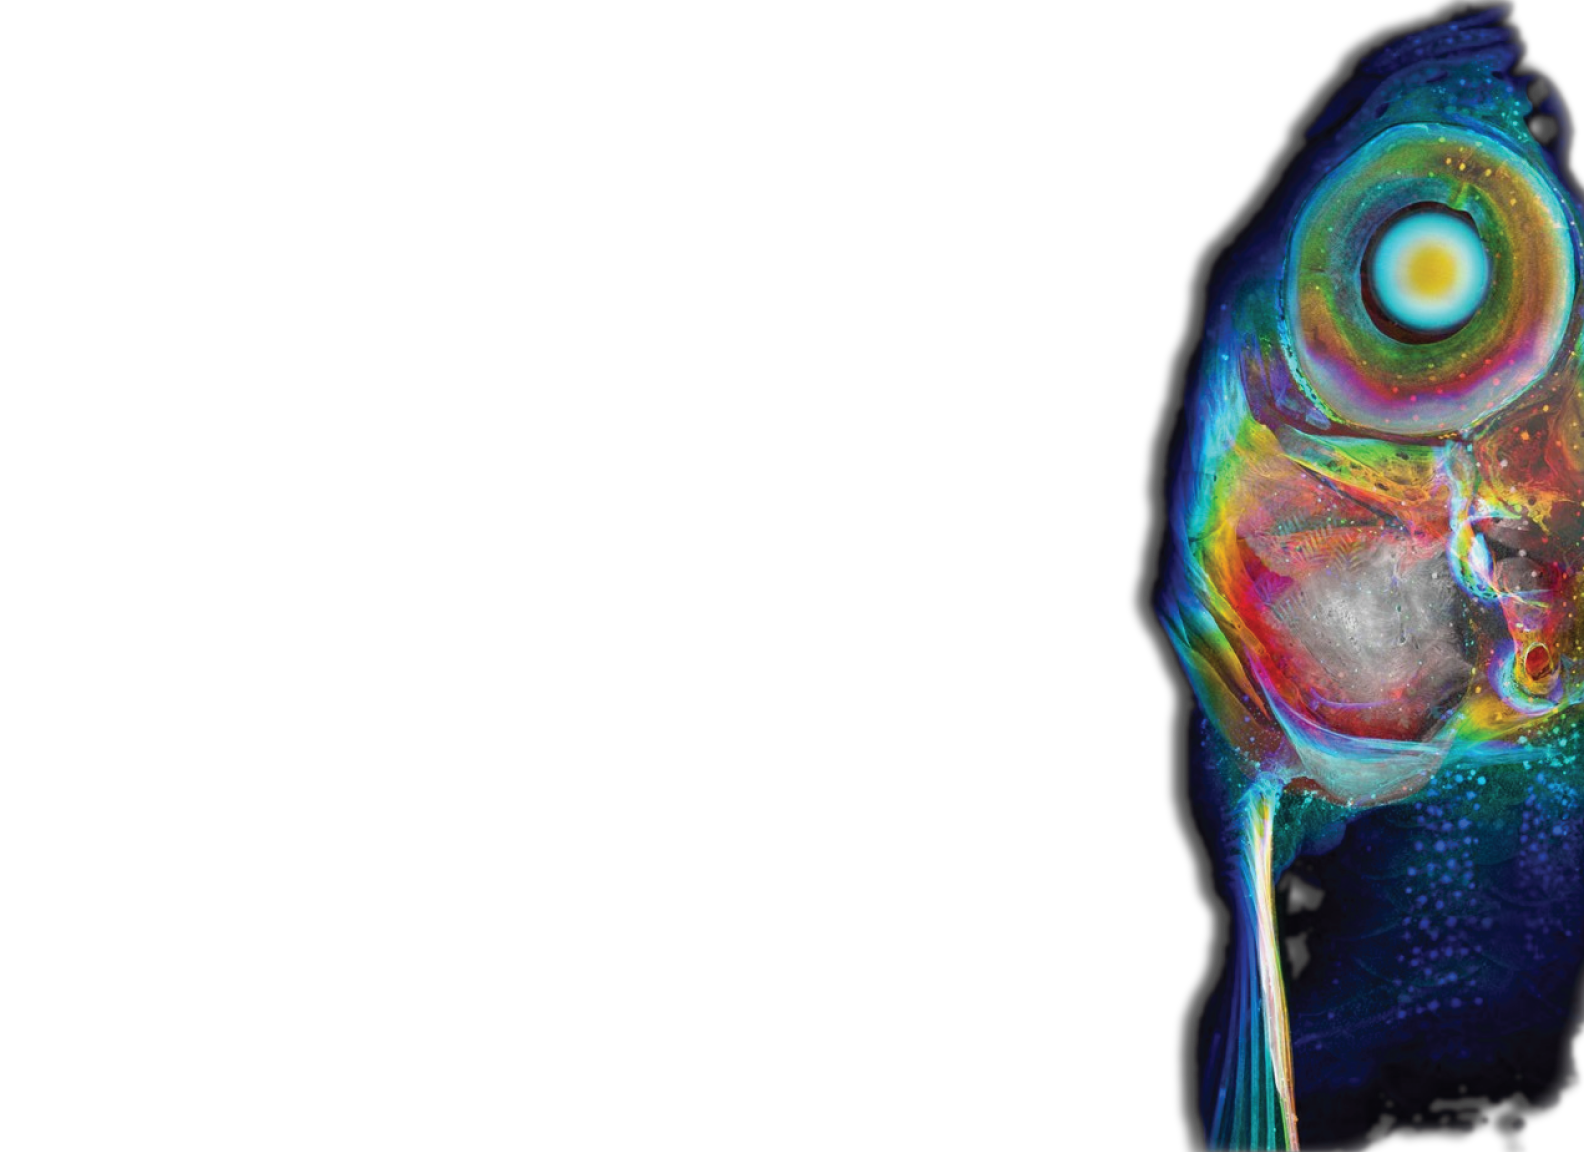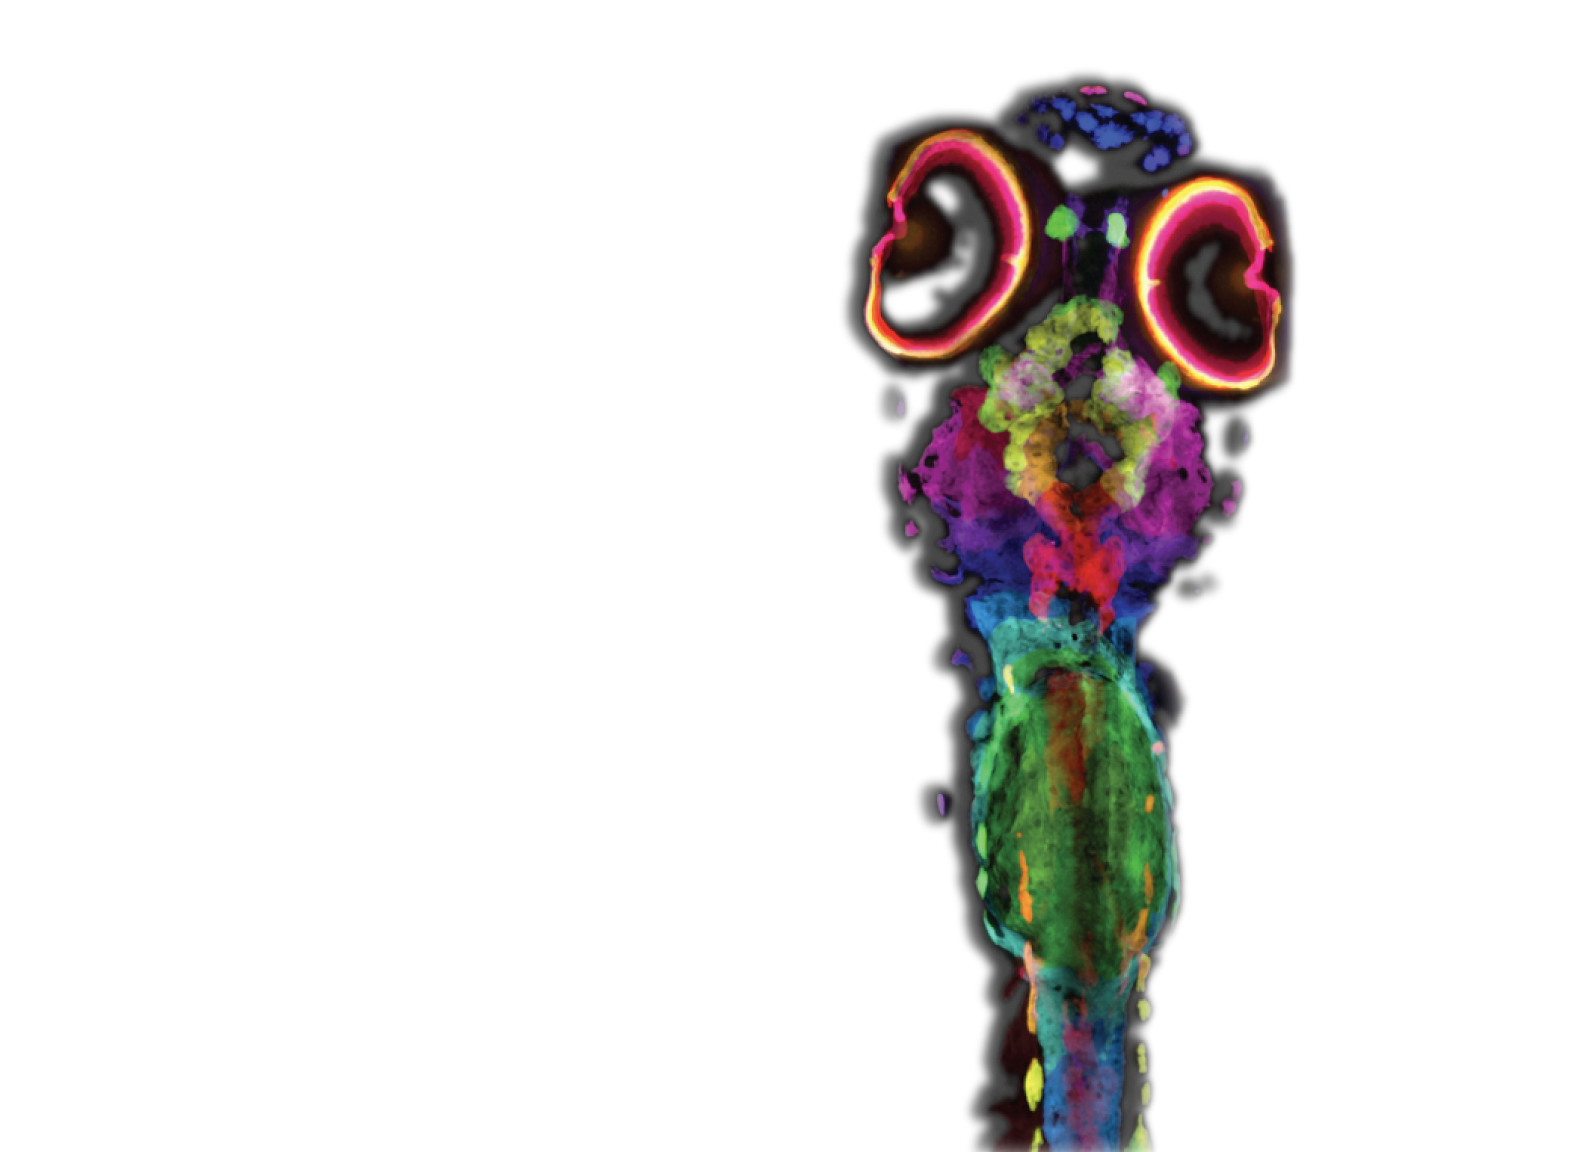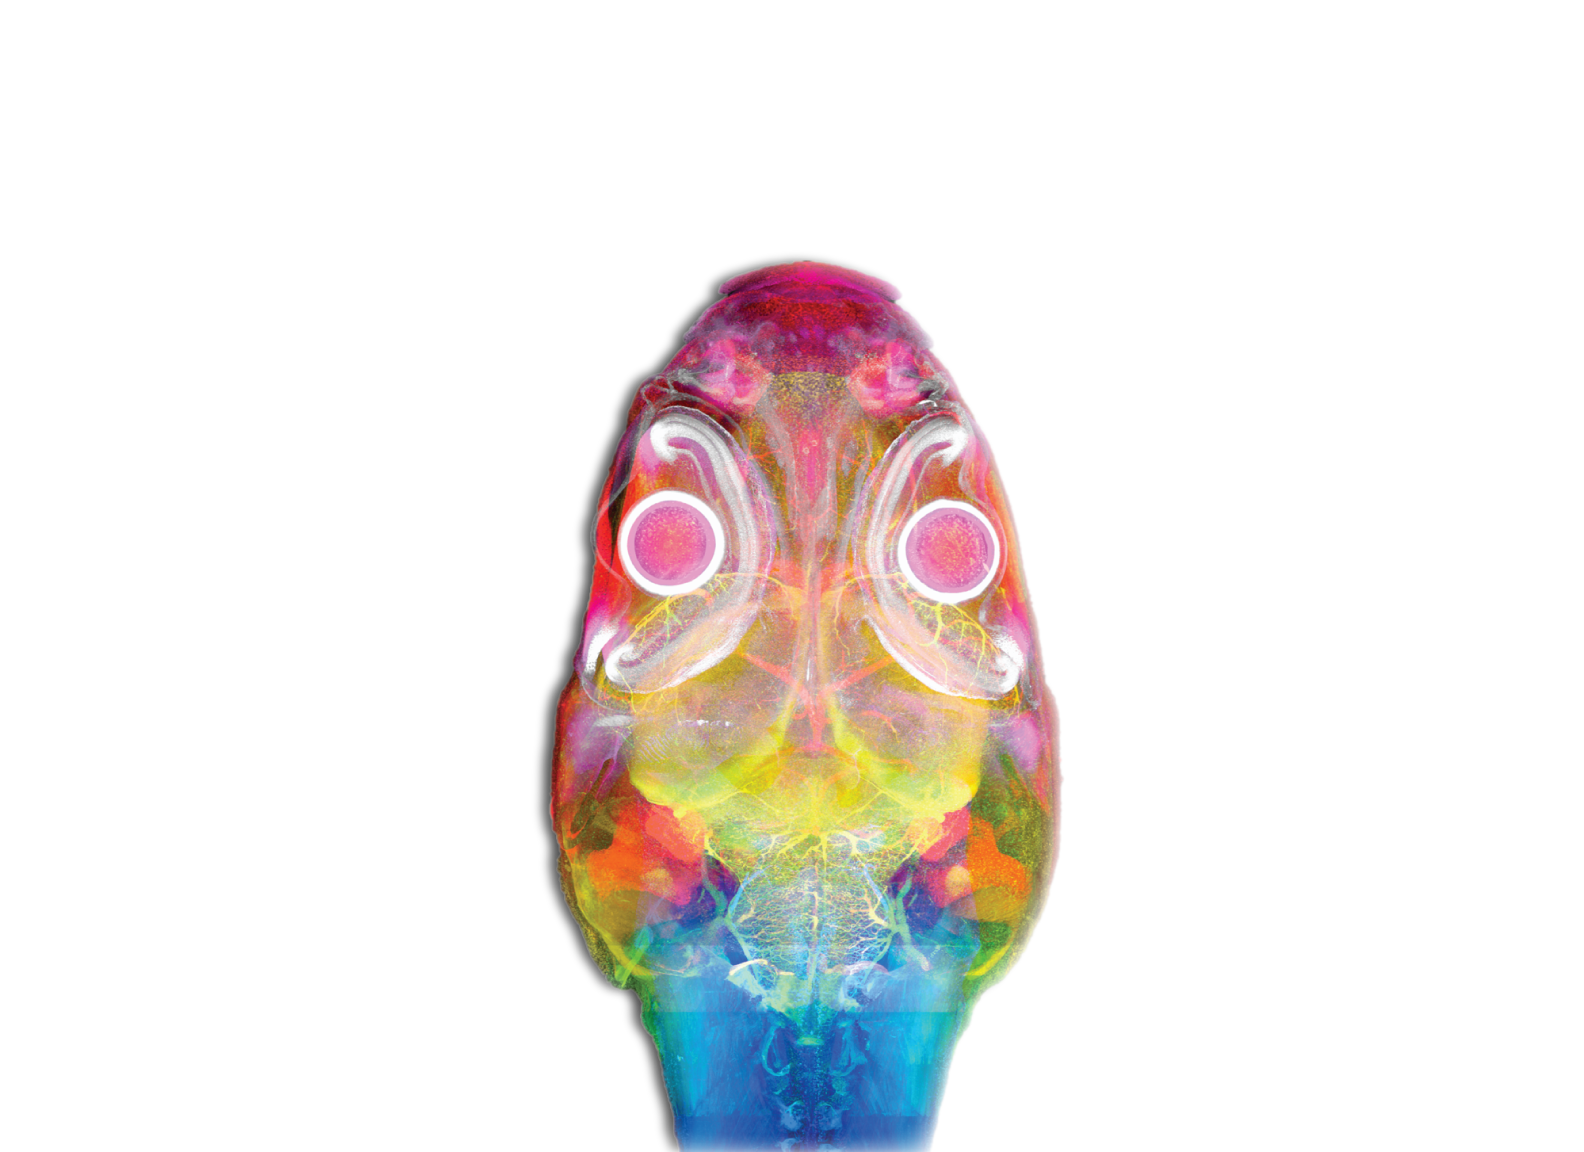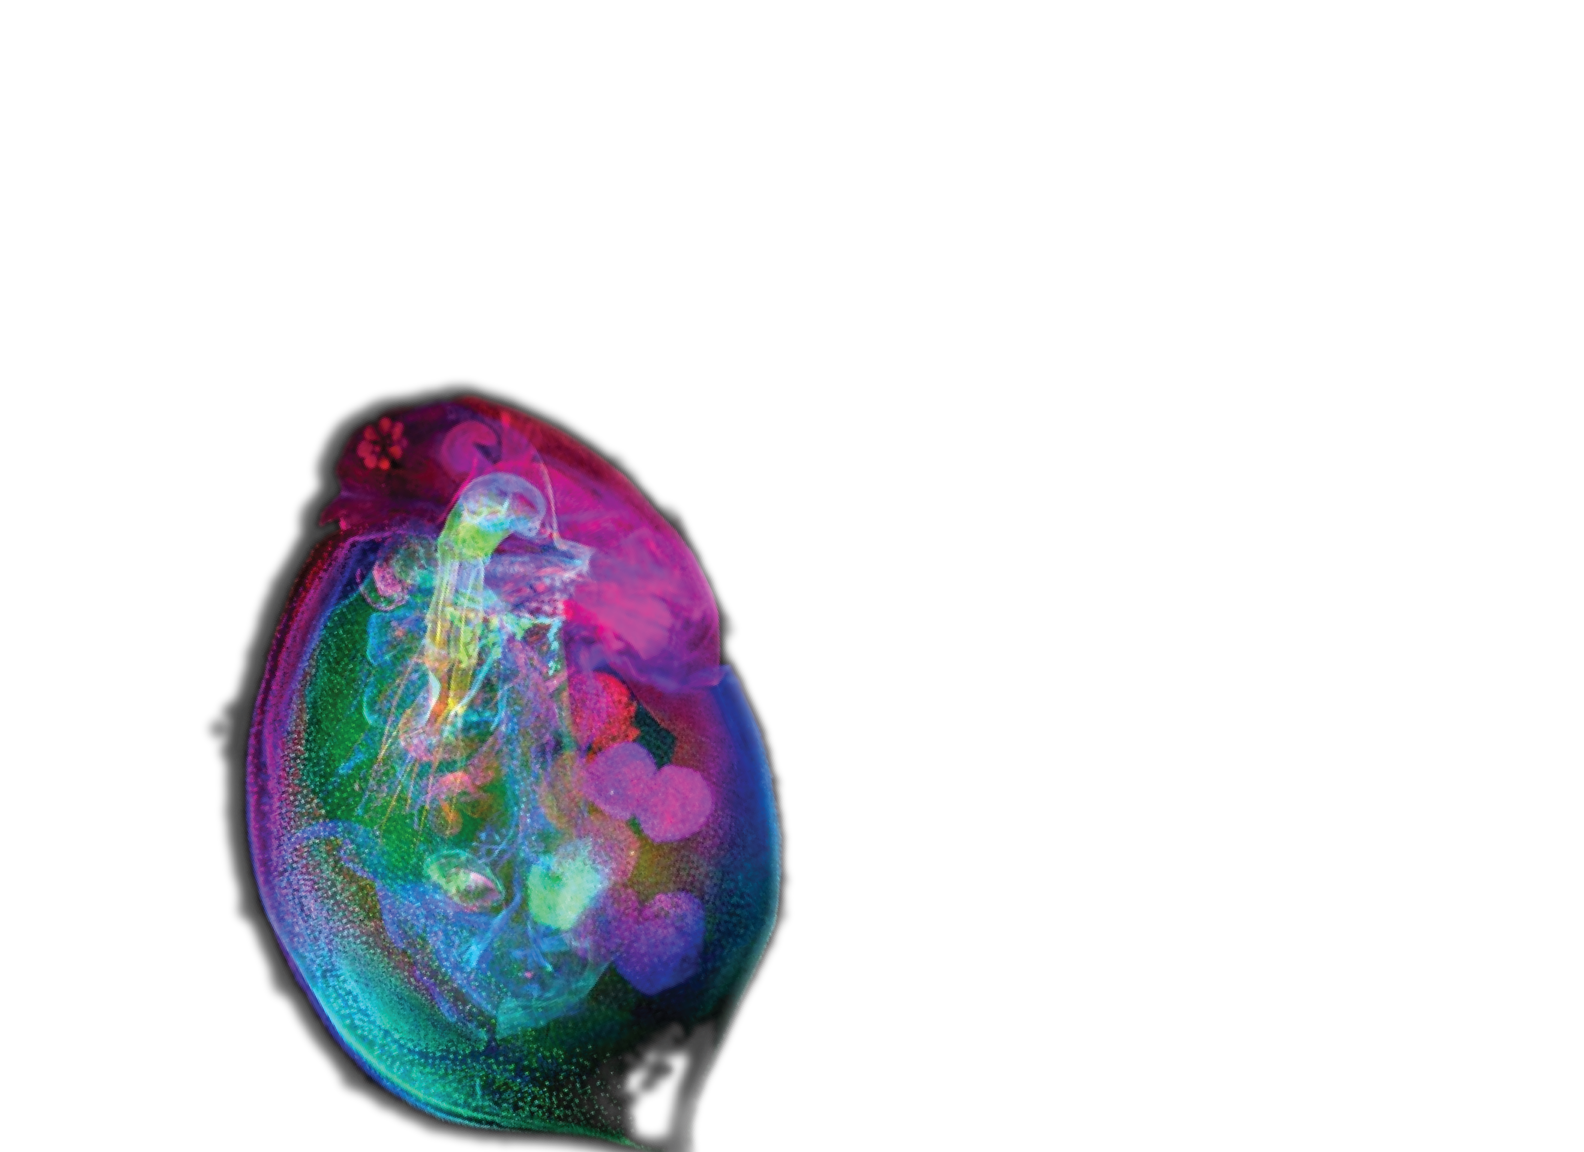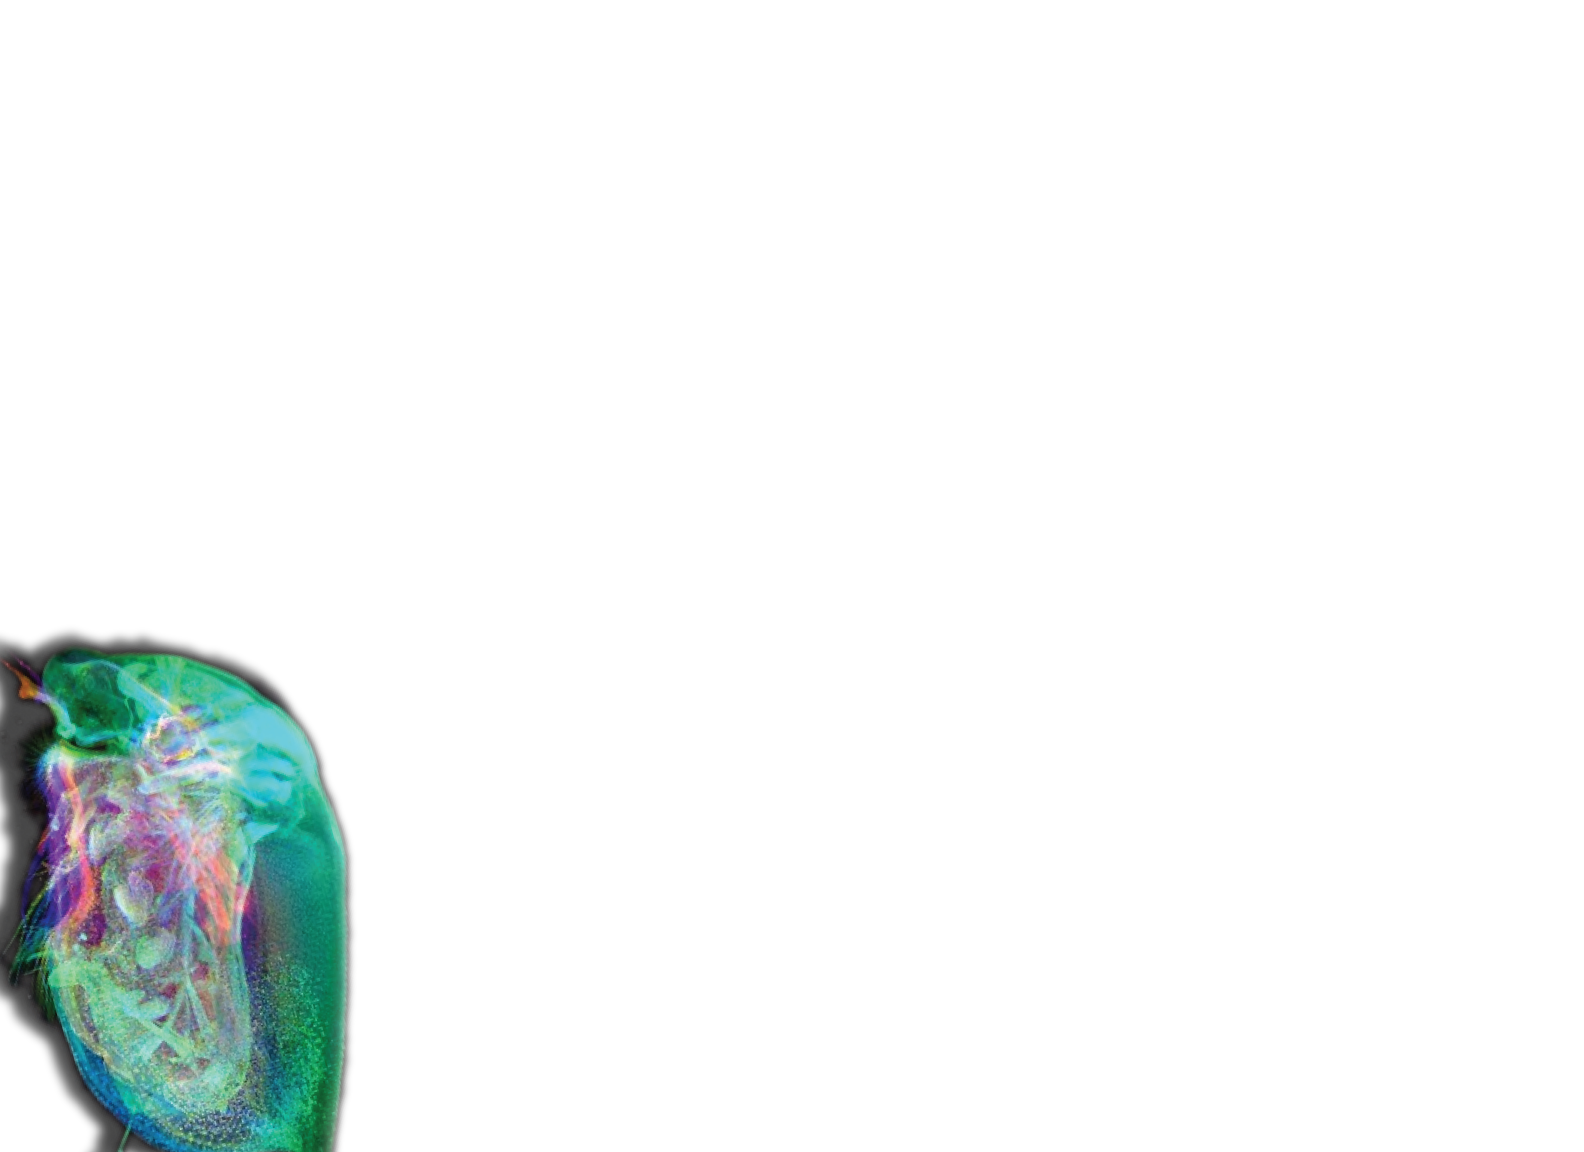
Whole animal · 0.7 µm voxels
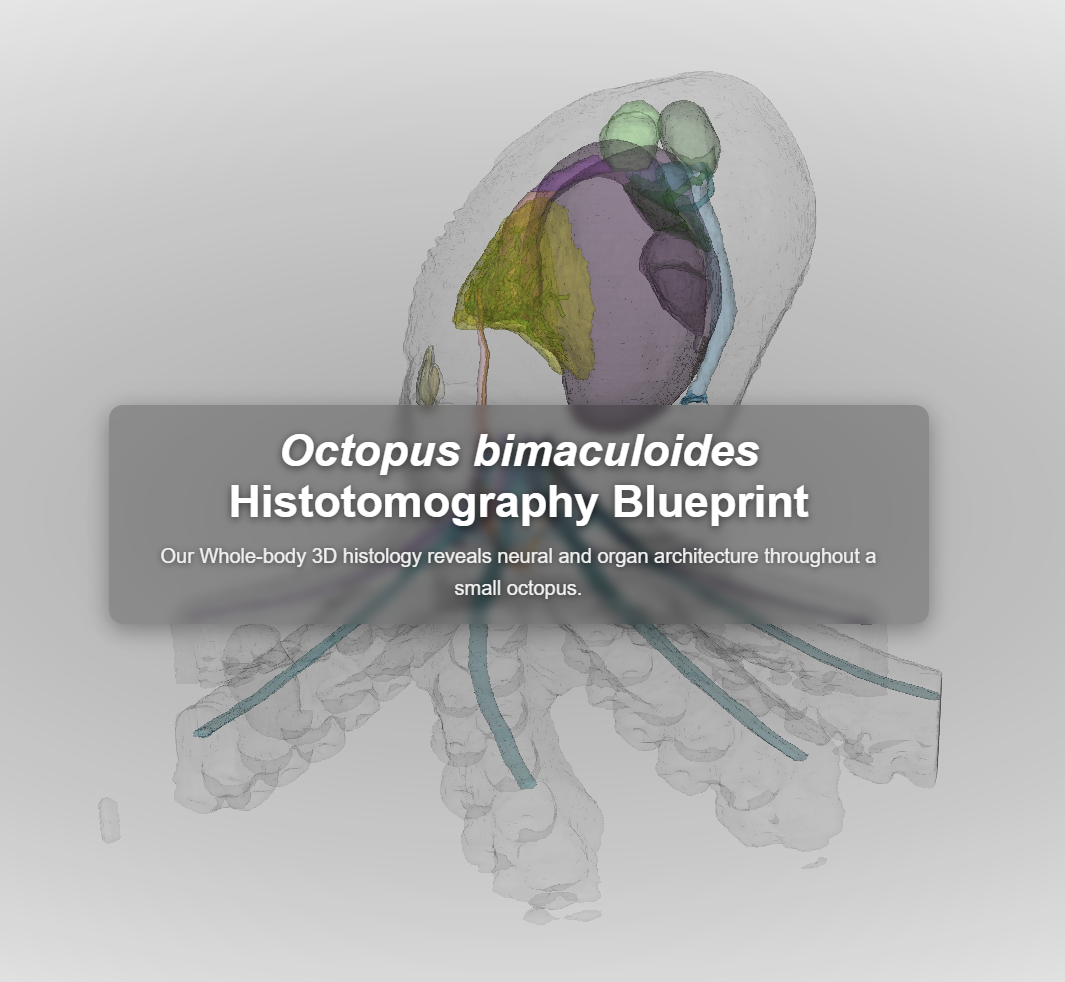
Octopus histotomography atlas
Explore a whole hatchling with a color-coded segmentation ontology, manuscript presets, and shareable viewer states.
Launch the atlasThe Geometry of Life and Disease
We combine 3D X-ray histotomography, AI-assisted segmentation, and statistical shape analysis to turn intact organisms and human tissue into quantitative phenotypes.
field of view
isotropic voxels
structures segmented
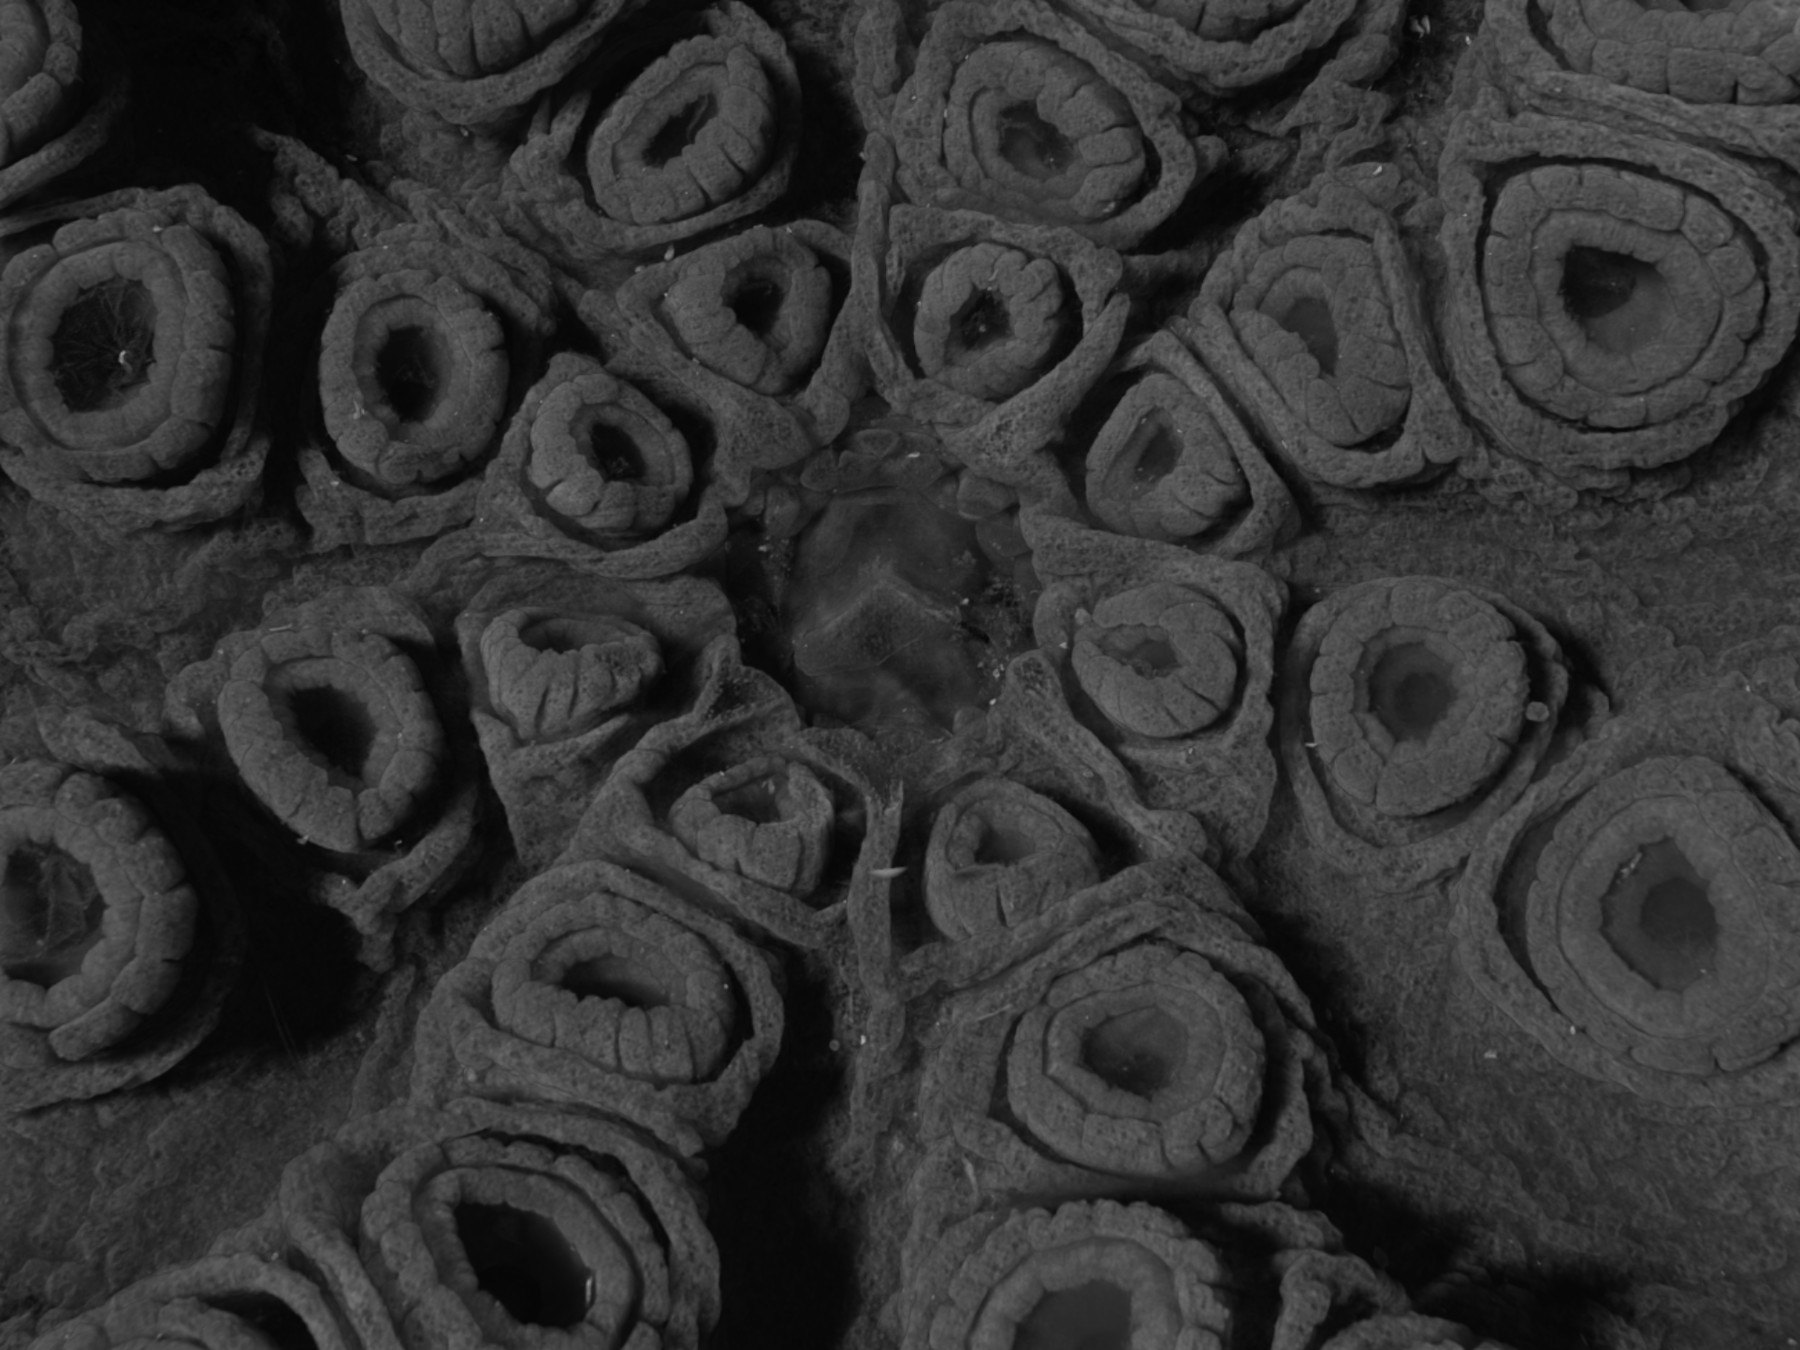
Selected results from the whole-octopus acquisition at APS beamline 2-BM.
Computational phenomics, plainly
Genomes describe possibility. Phenomes record what biology became: the size, shape, orientation, and relationships of cells and tissues in health, development, exposure, and disease.
01 / Matched-tissue validation
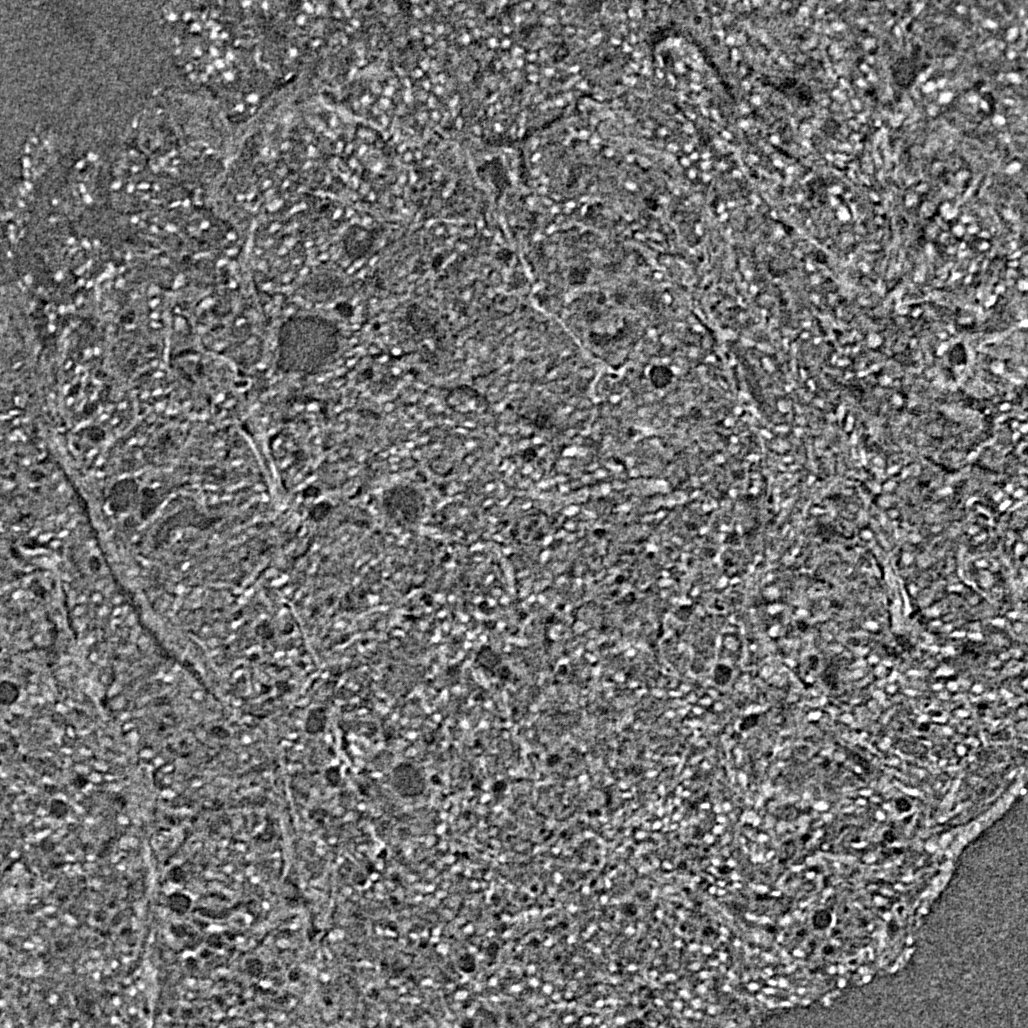
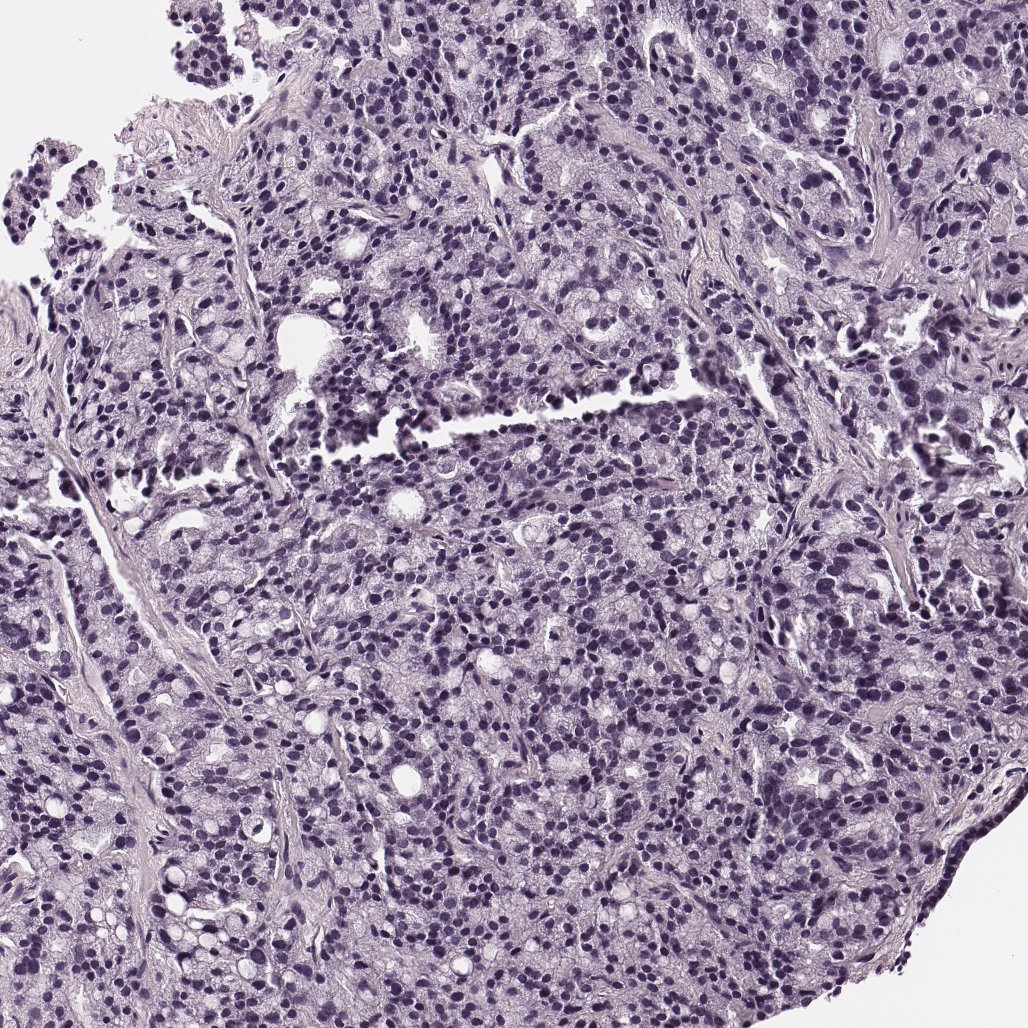
A prostate biopsy was scanned whole and unstained. After sectioning and staining, the physical H&E section was registered back to the corresponding plane in the 3D volume.
 Registered H&E
Raw microCT
Registered H&E
Raw microCT
Validation uses the familiar slide. The intact volume preserves everything around it.
02 / The imaging platform
Submicron soft-tissue microCT usually trades field of view for detail. A custom wide-field detector built for beamline 2-BM at the Advanced Photon Source expands that field to 10 mm at 0.7 µm isotropic voxels—wide enough to image an intact hatchling octopus in two acquisitions.
How the detector works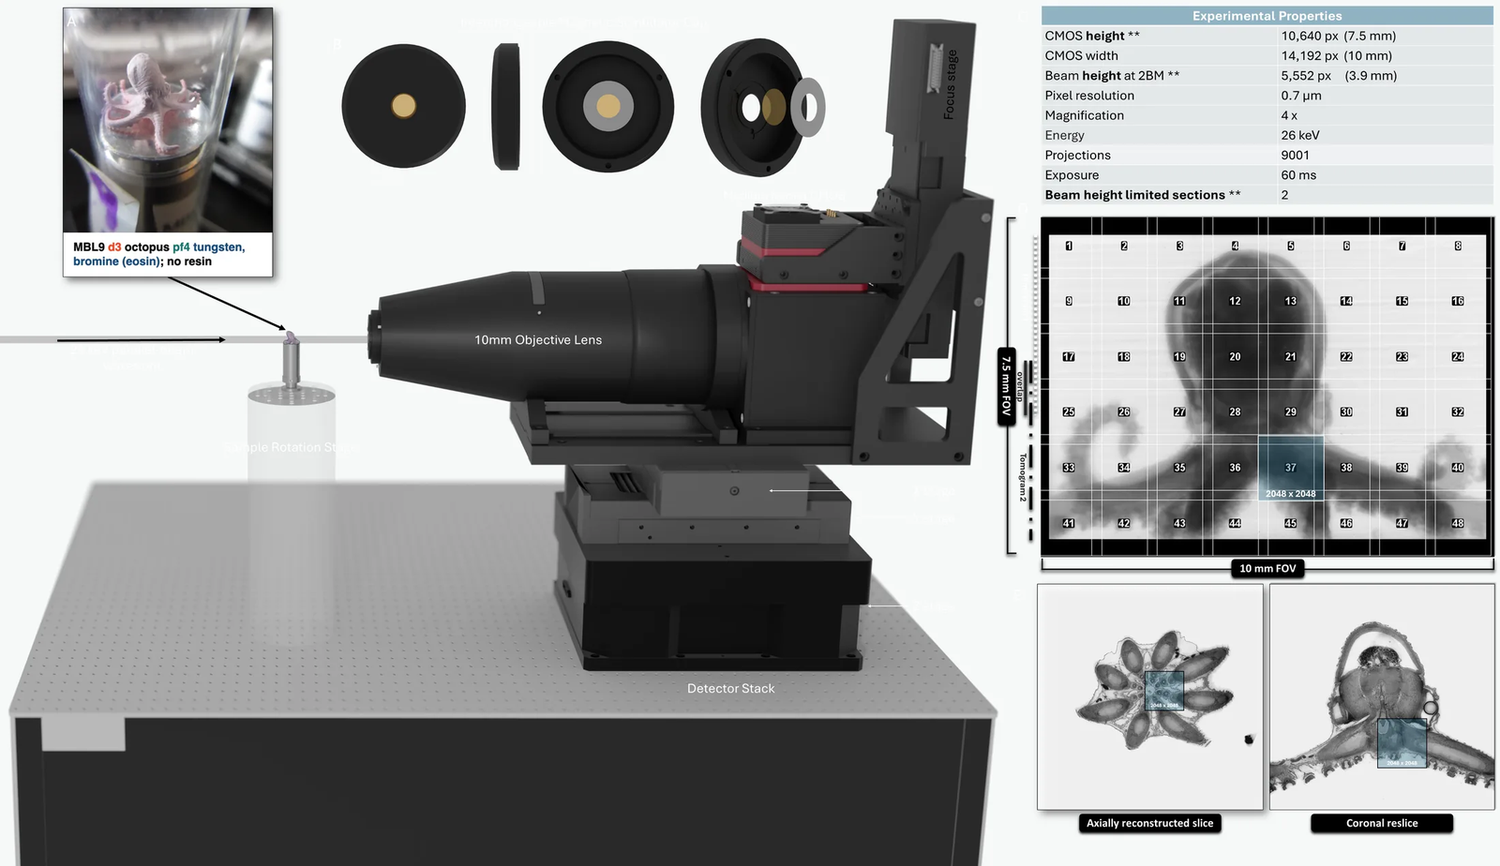
Detector family
Field of view, made visible
Choose a detector above. The gold frame shows its footprint on one physical scale; every aqua cell is a matched 2,048 × 2,048 detector footprint. This is a geometric coverage comparison—not a scan-row plan. Counts use a 15% overlap model; the diagram edge-aligns the sequence so no numbered field is clipped. Actual scans still depend on beam height and acquisition protocol.
APS 2-BM wide-field system
10mm active width
On this coverage model, one selected field replaces≈ 63 stitched 2K fields
The 14,192 × 10,640 array sets a 4:3 footprint: approximately 9 × 7, or 63 matched 2K detector equivalents.
A wider sensor changes more than the image footprint. Every projection contains more pixels, while a reconstructed volume adds an entire spatial dimension.
10 mm system example. At 9,001 projections and 14,192 × 10,640 pixels, 16-bit projections are approximately 2.7 TB uncompressed. A full 14,192 × 14,192 × 10,640 reconstruction stored at 32 bits is approximately 8.6 TB.
Decimal estimates are shown to communicate scale. Actual stored output varies with cropping, reconstruction geometry, compression, and processing workflow.
03 / Center programs
The center plan organizes seven connected programs around one pipeline, from imaging physics to useful evidence in medicine, research, industry, and public understanding.
Foundations
Advance sample handling, optics, reconstruction, artifact correction, and visualization toward an automated histotomography pipeline.
Identify and segment structures, extract quantitative features, and model morphology and topology across species and conditions.
Make very large images, workflows, and analytical tools usable through scalable storage, processing, and browser-based access.
Applications
Validate 3D tissue imaging against conventional histopathology and connect morphology with outcomes and molecular data.
Use whole-organism readouts to identify structural effects and toxicity earlier in preclinical development.
Measure how environmental exposures alter cells and tissues in sentinel organisms.
Turn complex anatomy and disease mechanisms into open, interactive resources for learners and the public.
04 / From morphology to statistics
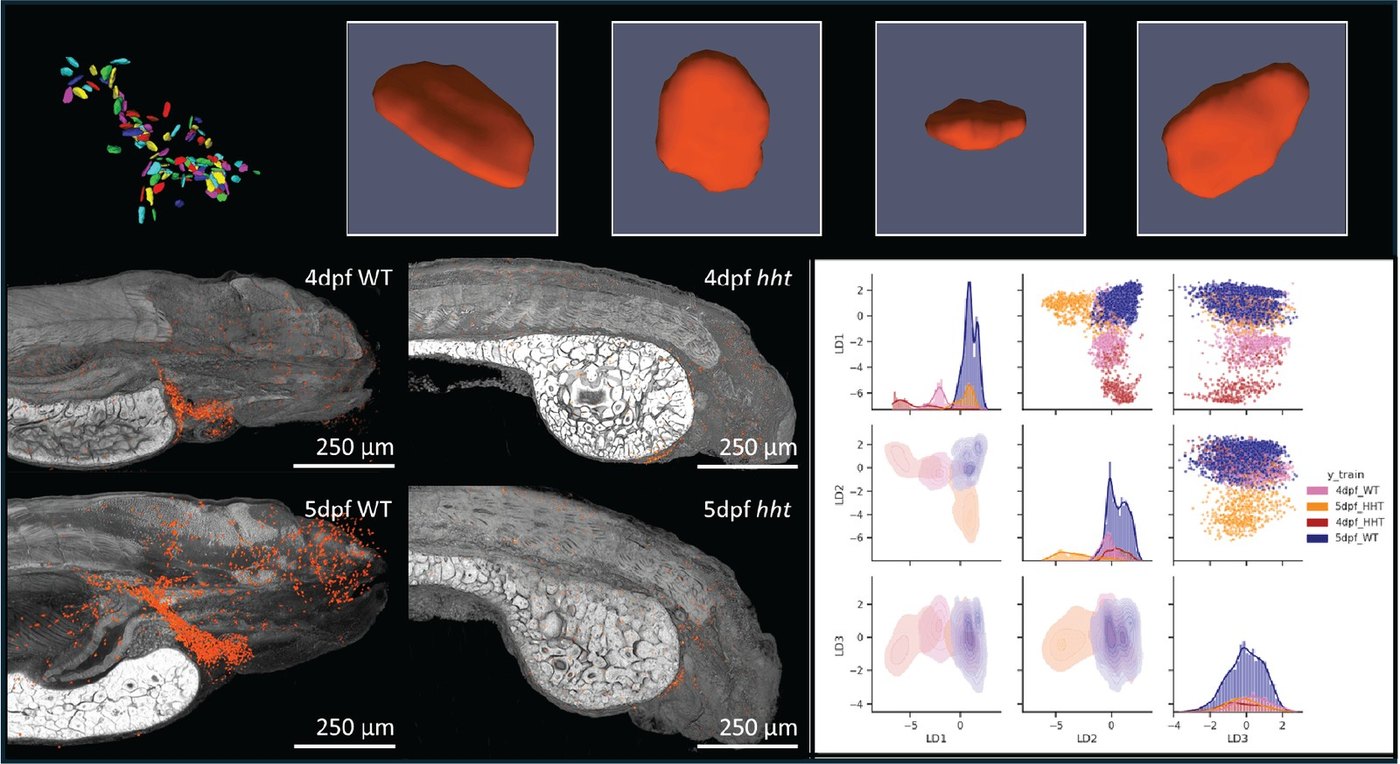
Segment each cell, measure its geometry and spatial relationships, then compare those measurements across genotype, age, exposure, and disease. Features that specialists recognize by eye become evidence that can be tested.
05 / Open the data
These are interactive datasets, not screenshots. A modern desktop browser can pan, zoom, slice in any plane, and follow structures through the depth of each specimen.
Whole animal · 0.7 µm voxels
Explore a whole hatchling with a color-coded segmentation ontology, manuscript presets, and shareable viewer states.
Launch the atlas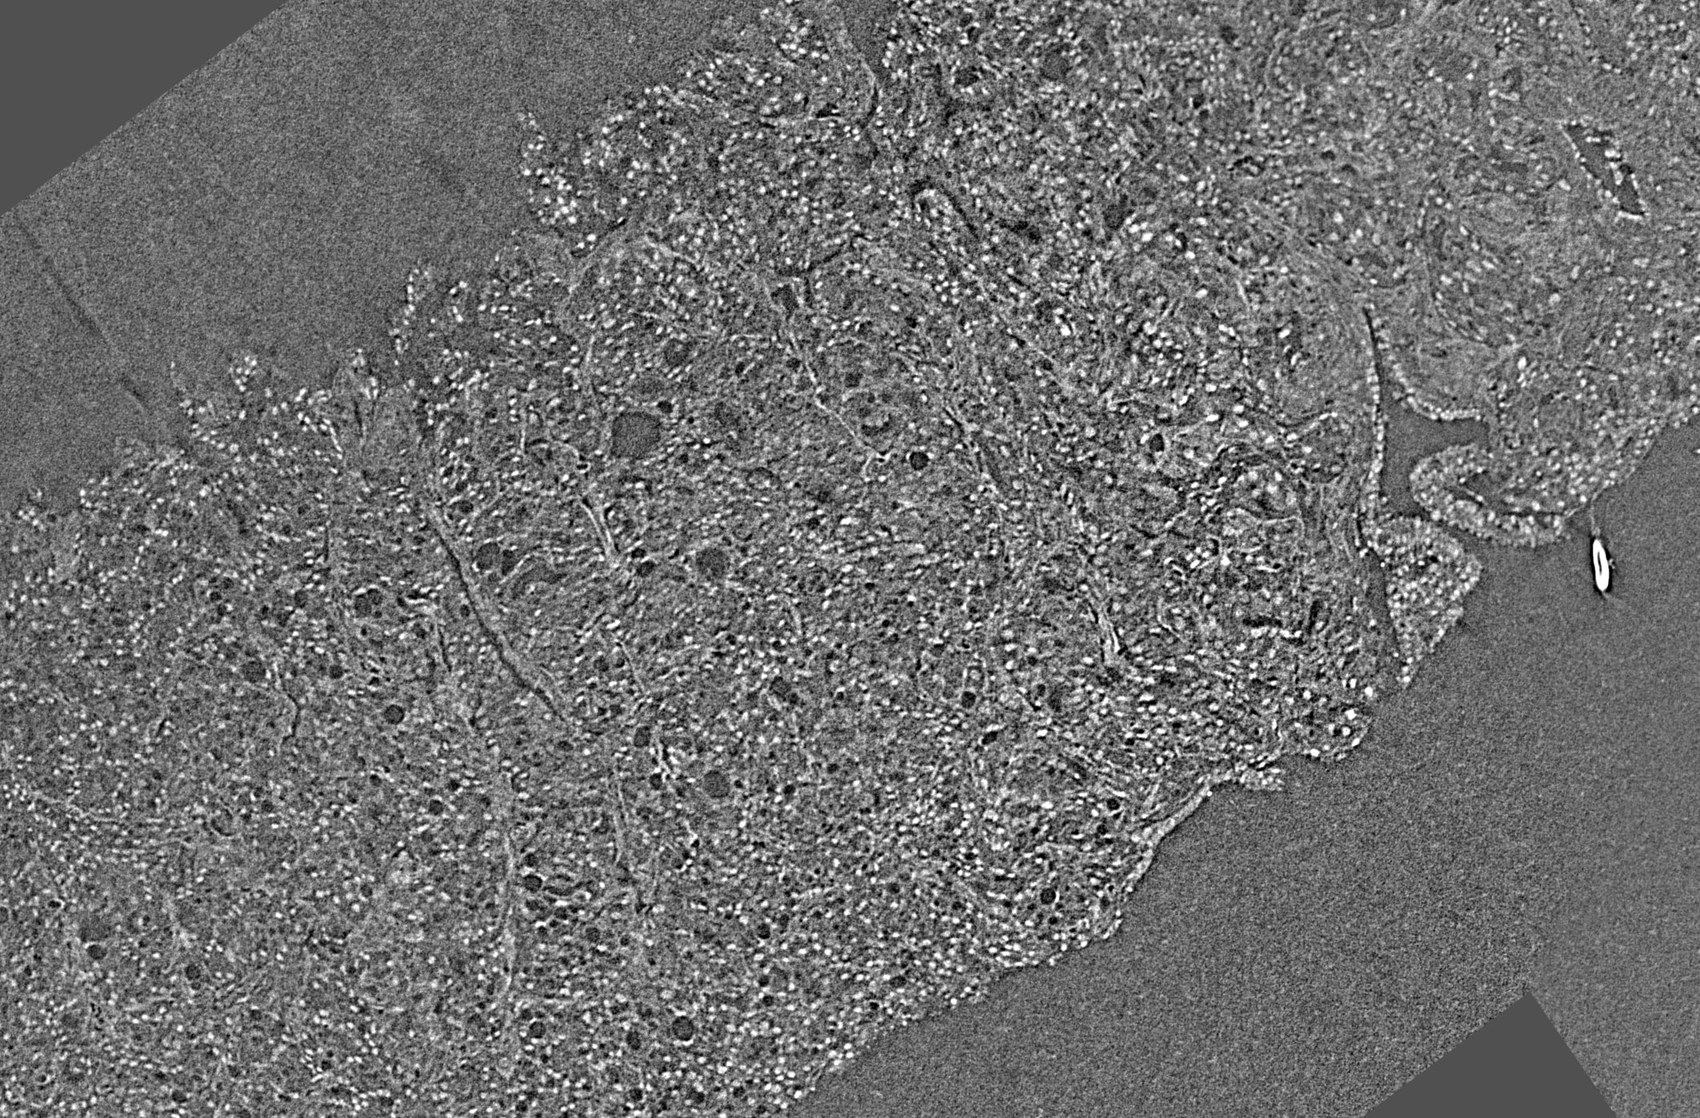
Human tissue
Follow nuclei and glandular structures through the depth of an unstained needle-core biopsy.
Open the viewerModel organisms
Explore zebrafish anatomy, teaching slides, and additional examples from the Cheng Lab.
View the collectionThe viewers stream large research datasets and work best on desktop with a reliable connection.
Work with us
Computational phenomics only works across fields. We welcome conversations with researchers, trainees, clinical teams, institutions, and industry partners.
Start a conversationPlan pilot imaging, analysis, visualization, or a collaborative proposal.
Ask about interdisciplinary opportunities spanning imaging, computation, and biology.
Explore work in instrumentation, diagnostics, pharmaceutical safety, agriculture, or AI.